Posts

How to Create the Best Infographic for Pinterest

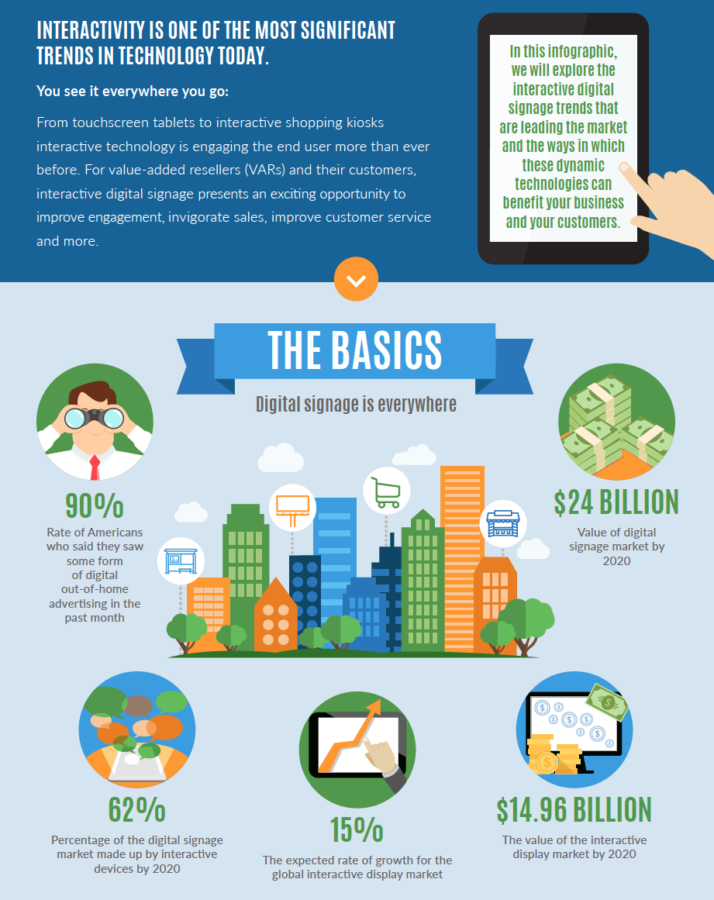
One of the best visual tools to use on Pinterest is Infographics. Over the past few years, infographics have become a big deal. They are a great way to visually explain data to people. Not only are they easy to follow and digest, but they are also a powerful tool for capturing the attention of your target audience, teaching them some tips and tricks, and sticking with them long after they’re out of sight. 

Let’s face it. Infographics just look at home on Pinterest. Be in on mobile or desktop, there is no denying that they fit perfectly on the Pinterest feed. And now, you’ll find thousands and thousands of infographics on the platform. So if you’re on those people or brands that are sharing infographics on Pinterest, then you’ll have to find a way to stand out. Otherwise, yours will be lost in the sea of content.   

People can get too caught up in making an infographic, what data do you use, where do you find that data, how do you create the image, what colors do you use, etc. The list goes on and on.

We have created a 5 step system for you to follow to create the
BEST infographics for Pinterest!

  • 1 – Picking the right topic
    • Does it relate to your business?
    • What topics in your industry do people find interesting?
    • Is this topic something you are passionate about?
    • What data do you want people to receive?
    • Can you tell a story within the graphic?
  • 2 – Be creative, funny, or useful
    • Can you get a reaction out of people?
    • Explain something to your audience that will resonate with them
    • Explain the data you want them to learn on their level
    • Will your image be shareable?
  • 3 – Keep it simple
    • Have a simple and clean image
    • Keep your infographic to 3-5 points
    • Using text and images within your infographic
    • Have a good Call-to-action within the graphic, don’t give it all away in one image
  • 4 – Look and feel
    • Make sure you are using clear fonts that your audience can read
    • Tie your infographic into your brand colors only use 2-3 colors per image
    • Put your sources on the bottom and your logo
    • Keep your infographic consistent with your brand
  • 5 – Sizes and dimensions
    • Vertical is the way to go in terms of pins. Make your image longer rather than wider
    • The best dimensions for infographic Pins on Pinterest are 1000 x 3000 with a Pinterest Pin ratio of 1:3
    • Infographic pins should be no larger than 600 x 2400 pixels. Otherwise, they’ll get cut off.

Wonderful, now you know how to create your infographic, what it needs to look like, the things you should have and shouldn’t have, but now the BIG question is where do you get all the data?? I know as an entrepreneur I am always looking at infographics on Pinterest for our company and for our clients, I say WOW that is awesome, I want to create something like that. BUT where did they get the data, how do they know the key points they want to talk about??

As you can see there is a lot that goes into making just ONE image, right? This is a process. It’s really about finding that perfect topic that you really want to share with the world and being able to explain it in such a way that everyone gets it! You have to do your research with each infographic, make the process fun. As you think of these ideas for your infographics, keep a journal or word doc to start collecting your data. 

Lastly, you may also want to consider Pinterest SEO. Not only will it help you drive more traffic to your website, but it will also help you improve your reach and ensure your pins are getting maximum results.

Conclusion

Remember you are always going to analyze your data and try to create a story with that data. Once you have your data, story, and image complete you can craft together a successful launch. Where will you place this image first? Each infographic needs to have your call-to-action, visually appealing, and clearly branded. Here are a few steps we recommend for a successful launch:

  • Write a blog post about your Infographic with the image within the blog content
  • Share to Pinterest, Google, Facebook
  • Make another image that is the correct size for Instagram and share it on Instagram

When you follow these steps to create the best infographics and implement our techniques in your data and design process you will be able to deliver an infographic that will resonate with your audience. An image that they will want to share and will build your brand.

If you need a hand in creating Pinterest infographics that stand out or need help with Pinterest marketing, please feel free to schedule a free 30-minute consultation call with us.

How to Create the Best Infographic for Pinterest

How to Create the Best Pinterest Infographic for Your BlogHow to Create the Best Pinterest Infographic for Your Nutrition Practice

How to Create the Best Pinterest Infographic for Your Mental Health Practice

Infographics are a HUGE part of Pinterest and those who love Pinterest absolutely adore infographics.  Infographics are an easy way to consume and learn new information.  A good infographic can take you step by step through a message with lots of visual content and a minimal amount of text.

In this video tutorial, you will learn how to quickly and easily design infographics by using Canva.


#1 VIDEO: 

A study by Animoto asked 1,000 consumers what they want to see with regard to social video. It also surveyed 500 marketers to determine whether they are fulfilling those expectations.

Highlights from the study were compiled into an infographic, which includes the following findings:

  • 39% of consumers are more likely to finish videos that have subtitles. (The infographic reports that, according to Digiday, 85% of Facebook video is watched without sound.)
  • Preference between pre-recorded video and Facebook Live was split nearly down the middle, with pre-recorded video having just a slight edge (52% vs. 48%).
  • 81% of marketers optimize their social videos for mobile.

#2 GIFS:

GIFs are the newest, coolest trend on social media and getting a lot of attention because not only are they easy to view, they also usually offer a call to action. Fun Fact – We may think that GIFs are a recent phenomenon in the world of digital marketing, BUT animated GIFs have been around for more than two decades!

Here are just a few ways how to incorporate GIFs into your digital marketing strategy:

  • The attention span of your audience is very low. GIFs are a smart way of reaching your target audience with a living picture of your message.
  • GIFs are an easy way to get engagement from your target audience and show them how something works.
  • Another way to use GIFs is through your email marketing, blogging, and other digital materials. It has been reported to raise the click through rate as well! GIFs are fun to watch, easy to find and easy to upload.
  • GIFs can be about a new process you have, new products, telling a story, explaining a situation, tell a joke etc.
  • GIF format can be done through Boomerang, GIF Keyboard, and GIPHY. There are tons of options out there for you!

#3 Infographics:

Remember last week we talked about ‘Stopping the SCROLL’? Great article by B2C:

6 Step Process to Amazing Infographic Design

Step 1: Choose your topic and research your audience.
Step 2: Take a look at your data and consolidate it.
Step 3: Craft the copy.
Step 4: Design!
Step 5: Review, review, review.
Step 6: Publish and promote.

Read more at http://www.business2community.com/infographics/6-step-process-amazing-infographic-design-01889770#WTg5RyjuR7dUWWoI.99

Finding ways to attract and encourage people to keep coming back to your site is no easy feat. If you are looking for ways to generate a stream of targeted traffic that converts, we recommend that you incorporate visual content into your digital marketing campaign.

Visual content is one of the most powerful online marketing tools. They are easy to consume and understand. On top of that, they also increase engagement, brand awareness and earn more new business.

Here are 3 types of visual content that will increase your conversion rate:

Infographics

We live in an era where an average person has an attention span of about 8 seconds. People want to get the information they want fast. Otherwise, they’ll move on swiftly to the next site. Infographics can help you reach your audience and grab their attention, mostly because you make things easier for them.

People love infographics. They are filled with valuable information, but are presented in a user-friendly layout. It requires less time to read, absorb and get the gist of information.

Images

Every day, the average consumer is exposed to a large volume of advertising messages. As such, it can be easy for your content to get lost in the jungle. Providing your text content with an appealing image can help you cut through the noise.

Photos are a great way to showcase your products and services. Take some photos of behind the scenes of your brand. Take some snaps shots of your team members, as well as the process that goes into creating your product. You may also include some photos of happy customers who have recently purchased your products or availed your services.

Videos

Studies suggest that posts with videos attract 300% more inbound links than text-only posts. But in order to set yourself apart in the digital era, you need to make sure that your video is of the highest caliber.

A great video serves as an extra clout for your campaign. It is useful for presenting common problems and then showing people how your products can solve that problem. Also, it is imperative that the videos are congruent with the overall style and ethos of your brand.

3 Types of Visual Content That Will Increase Your Conversion Rate

BIMS_9.9

Living in the digital world, there seems to be a surplus of information on the web. On average, we create 1.5 billion pieces of content, 2 million videos and 140 million tweets every day. The web is cluttered and the competition is tough.

If you are a digital marketer or a business owner, it is very easy for your content to get lost in the jungle, making it extremely difficult for your target audience to find you. If you want to break through the clutter and capture the attention of your target audience, you’ll have to create contents that are memorable, attractive and of high quality.

Here are some of the reasons why you should include infographics in your content marketing.

Easier to process

Visual content is a great way to make your content stand out online. This is because our brain processes visual content 60,000 times faster as compared to the time it takes to decode written contents. Plus, people are more likely to retain information that is presented in infographics.

Attention-grabbing

Humans are visual creatures. We are easily attracted to visual contents, facts and stats. Infographics presents a lot of contents, and these facts are attention-grabbing. In fact, views can jump up by as much as 48% if contents include photos and videos.

By combining well-written texts with visual elements, it can be a powerful tool that will help your content cut through the noise and into the brains of your target audience.

Positions you as an expert

Infographics are often presented in charts, graphs and tables to present the content in an easily understandable manner. A great deal of research has to be done before compiling the information into a one-page document. This highlights how knowledgeable the creator is in this particular niche.

By publishing useful and relevant infographics that educate and offer value to your target audience, it positions you as an expert in your niche.

Increase brand awareness

Infographics should include relevant information about the creator like company logo, email address, and website URL. This helps brand your business, and if used properly, it can increase your traffic by at least 12%.